Working with indicators
This activity aims to help you achieve a better understanding of this important matter.
The use of indicators is one of the core activities in any assessment process, regardless of the specific field of application. As well introduced by file F28 in module 2, “Indicators are qualitative or quantitative parameters that describe features of a certain, often complex and ill-defined, phenomenon and communicate an assessment of the phenomenon involved (Dopheide and Martinez, 2000). The latter implies that, although indicators can be either descriptive or normative, they always have implicitly or explicitly a reference to a norm. This makes indicators clearly different from simple measurements”.
This means that the selection and quality of indicators define the quality itself of information. Quality which means completeness, usability and clarity of information describing a certain matter or phenomena or territorial area: information needed to develop any vulnerability and resilience assessment.
STEP 1
The following figure can be found in module 2 and shows “Criteria to identify and select vulnerability indicators”. Are you able to fill the coloured areas with the right contents?
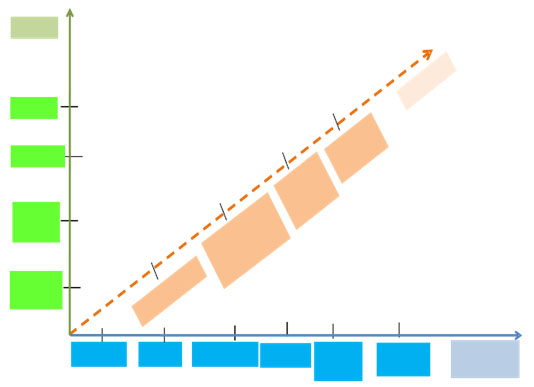
To help you remember that criteria are grouped along three main axes:
- On the x axe, the inherent characteristics of indicators are addressed;
- On the y axe, the characteristics of the data to be used to assess the indicators value in a given place are shown;
- On the z axe, the usefulness of indicators is appraised.
STEP 2
To develop a vulnerability assessment you need some categories of data/indicators: which ones?
To understand which sources are needed we have to make reference to the definition of vulnerability. You can find useful elements in files F02, chapter 3, and, mainly, in file F29.
STEP 3
Once data have been processed into a vulnerability assessment, it is important to organise them into tools for vulnerability analysis and representation. Tools must be able to transmit information and communicate about the vulnerability profile of a territorial area, becoming supports for decision making processes. Which instruments for the data visualisation can be found in the ENSURE documents?